From: Mark Fearer (mfearer@cox.net)
Date: Wed Oct 05 2005 - 06:41:11 EDT
Hello, list. Thanks to all who responded. Several expressed interest in
seeing a summary, so here goes. Also, I want to apologize if the wording of
my original question was vague, as I received many responses about how to
re-engineer my data center. Unfortunately, I am not in a position to do
that.
Original question:
Admins. Hello. I am in a data center that has roughly 200 HP servers. They
are A, D, K, L and N class and are running 11.0 or 11.11. They are mission
critical and require an uptime of 19x7 with a maintenance window from
midnight to 5:00am. We are constantly replacing failed hardware.
I wish to ask of the list some good verification exercises for testing
replaced hardware. Specifically:
hard drives - ioscan? diskinfo?
memory - stm?
cpu - stm? anything in the BCH?
tape devices - tar? ioscan? stm?
mother boards - firmware?
firmware - GSP? BCH?
fiber channel cards - ioscan? fcmutil?
Again, I am asking if anyone recommends some good testing for replaced
hardware mentioned above
Summary:
Disks
Memory
CPU
Tape devices
Network cards (NICs)
Mother boards
Firmware (GSP, PDC)
Fiber channel cards
DISKS
commands: ioscan, diskinfo, pvdisplay, vgdisplay, lvdisplay, lvlnboot,
setboot, stm, cstm, dmesg
files: /etc/fstab, /etc/lvmtab, /etc/lvmconf/vg##.conf, syslog.log, etc.
If a disk is replaced, two good commands for verifying that the system sees
the new disk are 'diskinfo' and 'ioscan -fnC disk'.
Doing an 'ioscan -fnC disk' command first should display all of the storage
devices that are attached to a server. You should see the H/W Type as
'DEVICE' and the S/W State as 'CLAIMED'. You should also see the H/W Path
and the device path displayed.
Example:
[root@sparky: ]# ioscan -fnC disk
Class I H/W Path Driver S/W State H/W Type Description
============================================================
disk 0 0/0/1/1.15.0 sdisk CLAIMED DEVICE HP
36.4GST336753LC
/dev/dsk/c1t15d0 /dev/rdsk/c1t15d0
disk 1 0/0/2/1.15.0 sdisk CLAIMED DEVICE HP
36.4GST336753LC
/dev/dsk/c3t15d0 /dev/rdsk/c3t15d0
A 'diskinfo' command followed by the raw character device path should give
you the basic technical specifications of the disk.
Example:
[root@sparky: ]# diskinfo /dev/rdsk/c1t15d0
SCSI describe of /dev/rdsk/c1t15d0:
vendor: HP 36.4G
product id: ST336753LC
type: direct access
size: 35566480 Kbytes
bytes per sector: 512
You can test a disk for bad sectors and read errors with the following
exercise:
dd in=/dev/rdsk/<your_disk> of=/dev/null bs=64k
Example:
[root@sparky: ]# dd if=/dev/rdsk/c1t15d0 of=/dev/null bs=64k
555726+1 records in
555726+1 records out
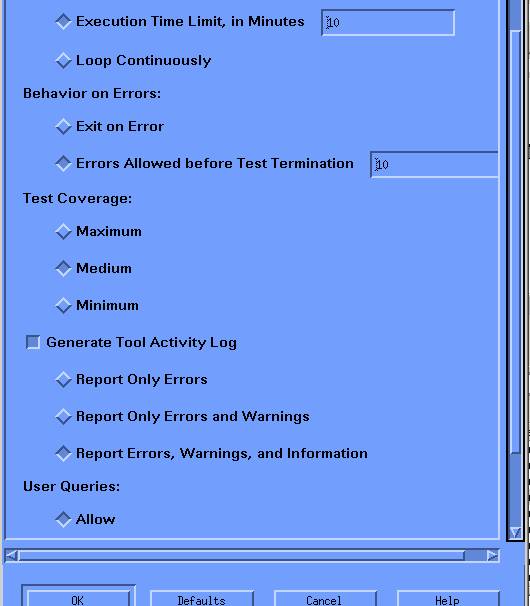
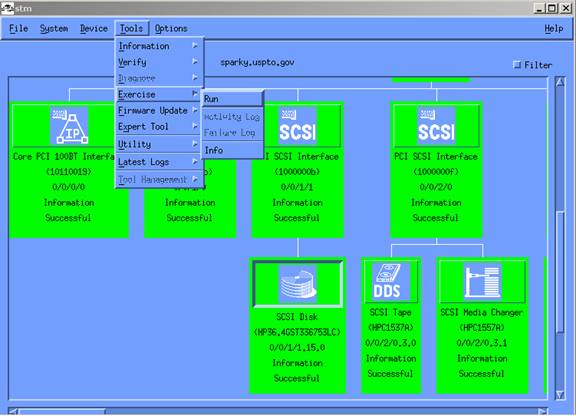
Another exercise that will test your disk is 'stm'. From the command line,
enter 'stm'. This will invoke a GUI or a TUI. From this menu, you can
highlight your device, then choose 'Tools', 'Exercise', 'Run'.
Example:
If you are getting replacement parts from a vendor, I would try and make
sure you can burn them in somewhere for at least a couple of days. You
might also look into keeping track of any serial numbers or unique ids on
the parts.
MEMORY
commands: stm, cstm, dmesg, top, glance
files: /var/adm/messages
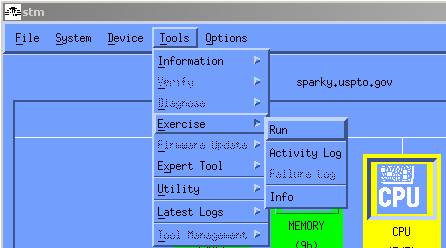
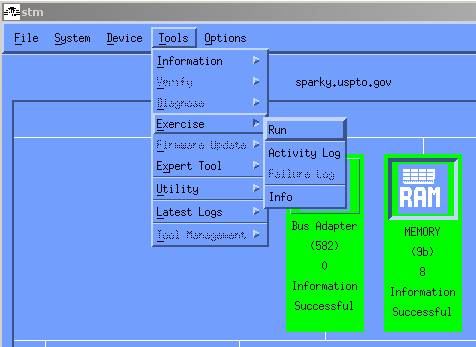
An exercise that will test your memory is 'stm'. From the command line,
enter 'stm'. This will invoke a GUI or a TUI. From this menu, you can
highlight your device, then choose 'Tools', 'Exercise', 'Run'.
Example:
Another exercise that will test your memory is 'top'. From the command
line, enter 'top'. This will invoke a text output graph of the top processes
that are using real time resources and shows the current usage of memory and
cpu.
Example:
top
System: sparky Mon Oct 3 15:47:03
2005
Load averages: 0.16, 1.03, 0.88
167 processes: 148 sleeping, 19 running
Cpu states:
CPU LOAD USER NICE SYS IDLE BLOCK SWAIT INTR SSYS
0 0.15 0.2% 0.0% 0.2% 99.6% 0.0% 0.0% 0.0% 0.0%
1 0.18 0.2% 0.0% 0.0% 99.8% 0.0% 0.0% 0.0% 0.0%
--- ---- ----- ----- ----- ----- ----- ----- ----- -----
avg 0.16 0.2% 0.0% 0.2% 99.6% 0.0% 0.0% 0.0% 0.0%
Memory: 147732K (89772K) real, 231180K (143120K) virtual, 957008K free
Page# 1/
16
CPU TTY PID USERNAME PRI NI SIZE RES STATE TIME %WCPU %CPU
COMMAND
0 ? 37 root 152 20 6464K 6464K run 0:14 0.43 0.43 vxfsd
1 ? 2111 root 152 20 14804K 4040K run 0:01 0.20 0.20 dmisp
0 ? 3755 root 152 20 37980K 6944K run 0:13 0.18 0.18
mhragent
Still another exercise that will test your memory is Measureware's 'glance'.
>From the command line, enter 'glance'. This will invoke a text output graph
of the top processes that are using real time resources and shows the
current usage of memory and cpu.
Example:
B3692A GlancePlus C.03.72.00 16:14:43 sparky 9000/800 Current Avg
High
----------------------------------------------------------------------------
----
CPU Util SA | 3% 3%
3%
Disk Util FV | 3% 3%
3%
Mem Util S SU UB B | 54% 54%
54%
Swap Util U URR | 16% 16%
16%
----------------------------------------------------------------------------
----
PROCESS LIST Users=
2
User CPU Util Cum Disk
Thd
Process Name PID PPID Pri Name ( 200% max) CPU IO Rate RSS
Cnt
----------------------------------------------------------------------------
----
glance 8899 8018 168 root 4.0/ 4.6 0.1 6.0/30.9 6.6mb
1
swapper 0 0 127 root 0.0/ 0.0 1.3 1.3/ 0.2 32kb
1
vxfsd 37 0 138 root 0.0/ 0.1 17.9 1.3/ 9.6 6.3mb
16
CPU
commands: stm, cstm, top, glance
You might consider opening a several windows and running
recursive jobs such as 'find', 'll -R', 'cp'. You can generate good cpu
loads and make sure you are getting all cpu's by monitoring with a 'top' or
a 'glance'.
Example of a 'top':
System: sparky Tue Oct 4 13:29:04
2005
Load averages: 0.00, 0.02, 0.04
183 processes: 163 sleeping, 20 running
Cpu states:
CPU LOAD USER NICE SYS IDLE BLOCK SWAIT INTR SSYS
0 0.00 0.0% 0.0% 0.0% 100.0% 0.0% 0.0% 0.0% 0.0%
1 0.00 0.0% 0.0% 0.0% 100.0% 0.0% 0.0% 0.0% 0.0%
--- ---- ----- ----- ----- ----- ----- ----- ----- -----
avg 0.00 0.0% 0.0% 0.0% 100.0% 0.0% 0.0% 0.0% 0.0%
Memory: 159532K (94984K) real, 244976K (146336K) virtual, 879716K free
Page# 1/
17
CPU TTY PID USERNAME PRI NI SIZE RES STATE TIME %WCPU %CPU
COMMAND
1 ? 37 root 152 20 6464K 6464K run 1:04 0.31 0.31 vxfsd
Example of a 'glance':
B3692A GlancePlus C.03.72.00 13:31:52 sparky 9000/800 Current Avg
High
----------------------------------------------------------------------------
----
CPU Util S | 1% 1%
2%
Disk Util F | 2% 2%
2%
Mem Util S SU UB B | 58% 58%
58%
Swap Util U URR | 17% 17%
17%
----------------------------------------------------------------------------
----
PROCESS LIST Users=
5
User CPU Util Cum Disk
Thd
Process Name PID PPID Pri Name ( 200% max) CPU IO Rate RSS
Cnt
----------------------------------------------------------------------------
----
glance 15070 14158 154 root 1.1/ 2.3 0.2 0.1/ 9.4 6.8mb
1
swapper 0 0 127 root 0.0/ 0.0 2.7 1.3/ 0.2 32kb
1
vxfsd 37 0 138 root 0.0/ 0.1 63.8 4.0/ 3.8 6.3mb
18
Of course, there is 'stm', too, for stress testing a CPU.
Example:
You can disable a CPU by rebooting and pausing at the firmware prompts. You
can then go to
the COnfigure section and enable or disable CPU's from the firmware.
If you are getting replacement parts from a vendor, I would try and make
sure you can burn them in somewhere for at least a couple of days. You
might also look into keeping track of any serial numbers or unique ids on
the parts.
TAPE DEVICES
Commands: ioscan, stm, tar
Upon replacement of a tape device, do an 'ioscan -fnC tape' or an 'ioscan
-fn' to assure that the new device is seen on the bus and that it is
claimed.
Example:
[root@smith: ]# ioscan -fnC tape
Class I H/W Path Driver S/W State H/W Type Description
=====================================================================
tape 0 0/0/1/0.3.0 stape CLAIMED DEVICE HP C1537A
/dev/rmt/0m /dev/rmt/c0t3d0BESTn
/dev/rmt/0mb /dev/rmt/c0t3d0BESTnb
/dev/rmt/0mn /dev/rmt/c0t3d0DDS
/dev/rmt/0mnb /dev/rmt/c0t3d0DDSb
/dev/rmt/c0t3d0BEST /dev/rmt/c0t3d0DDSn
/dev/rmt/c0t3d0BESTb /dev/rmt/c0t3d0DDSnb
'ioscan' will show you if it's on the bus, but won't tell you about the
condition of the heads. Do some write/read to the tape.
Do some 'tar' tests. For example, you may want to search the /tmp directory
for some medium sized file to 'tar' to (cvf) and then extract from (xvf) the
new tape device.
Example:
[root@smith: tmp]# cd /tmp
[root@smith: tmp]# ll
-rw-r--r-- 1 oracle dba 42350 May 8 10:05 DB_Check.sql
[root@smith: tmp]# tar cvf /dev/rmt/0m DB_Check.sql
a DB_Check.sql 83 blocks
Check the 'tar' to tape with a 'tvf' (table of contents).
[root@smith: tmp]# tar tvf /dev/rmt/0m
rw-r--r-- 103/102 42350 May 8 10:05 2005 DB_Check.sql
Compare the original file with the file that was tarred to and then
extracted from tape with use of the 'cksum' command.
[root@smith: tmp]# pwd
/tmp
[root@smith: tmp]# mkdir test
[root@smith: tmp]# cd test
[root@smith: test]# tar xvf /dev/rmt/0m
x DB_Check.sql, 42350 bytes, 83 tape blocks
[root@smith: test]# cksum DB_Check.sql
4182244438 42350 DB_Check.sql
[root@smith: test]# cd ..
[root@smith: tmp]# cksum DB_Check.sql
4182244438 42350 DB_Check.sql
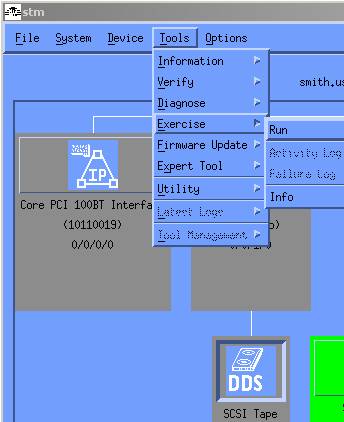
And, of course, there is 'stm' which can be used to stress test a tape
device. Assure that you have a tape loaded that can be written to (with no
valuable data on it, as it will be overwritten).
Example:
There may be cases of 'tar' failing with an error message 'end of tape
reached' in a few seconds from starting the backup. It would happen even
with a fresh tape. Eventually I found out that the tape drive (DDS3) wasn't
recognizing only 125m tapes (which it has always been recognizing). The same
works fine with 90 or 120m tapes.
If you are getting replacement parts from a vendor, I would try and make
sure you can burn them in somewhere for at least a couple of days. You
might also look into keeping track of any serial numbers or unique ids on
the parts.
NETWORK CARDS (NICS)
Commands: lanadmin, lanscan, netstat -in
Find the driver:
'ioscan -fkC lan' will display the btlan driver loaded in the kernel.
Example:
[root@sparky: tmp]# ioscan -fkC lan
Class I H/W Path Driver S/W State H/W Type Description
==================================================================
lan 0 0/0/0/0 btlan CLAIMED INTERFACE HP PCI 10/100Base-TX
Core
lan 1 0/2/0/0 btlan CLAIMED INTERFACE HP A5230A/B5509BA PCI
10/100Base-TX Addon
lan 2 0/4/0/0 btlan CLAIMED INTERFACE HP A5230A/B5509BA PCI
10/100Base-TX Addon
'lanadmin'
Example:
[root@sparky: tmp]# lanadmin -x 1
Current Config = 100 Full-Duplex MANUAL
'lanscan'
Example:
[root@sparky: tmp]# lanscan
Hardware Station Crd Hdw Net-Interface NM MAC HP-DLPI
DLPI
Path Address In# State NamePPA ID Type Support
Mjr#
0/0/0/0 0x00306E1CC054 0 UP lan0 snap0 1 ETHER Yes
119
LinkAgg0 0x001083F67C58 900 UP lan900 snap900 5 ETHER Yes
119
LinkAgg1 0x000000000000 901 DOWN lan901 snap901 6 ETHER Yes
119
LinkAgg2 0x000000000000 902 DOWN lan902 snap902 7 ETHER Yes
119
LinkAgg3 0x000000000000 903 DOWN lan903 snap903 8 ETHER Yes
119
LinkAgg4 0x000000000000 904 DOWN lan904 snap904 9 ETHER Yes
119
'netstat -in'
Example:
[root@sparky: tmp]# netstat -in
Name Mtu Network Address Ipkts Ierrs Opkts Oerrs
Coll
lo0 4136 127.0.0.0 127.0.0.1 2935 0 2935 0 0
lan900 1500 10.112.151.0 10.112.151.142 43284362 25 16608331 0
0
If you use APA (Auto Port Aggregation), the command to display the output of
APA is a 'lanscan -q'.
Example:
[root@sparky: tmp]# lanscan -q
0
900 1 2
901
902
903
904
You can also test the speed of the network connection by choosing a medium
sized file and doing a secure copy to some remote host.
Example:
[root@sparky: tmp]# scp sparky-2.log etc-k09:/tmp
Password:
sparky-2.log 100% 203KB 3.2MB/s 00:00
Driver Configuration file. Use this to match the lan found with a 'lanscan'
or a 'netstat -in' with its proper driver.
name in /etc/rc.config.d/
Driver duplex file Description Software
----------------------------------------------------------------
btlan hpbtlanconf
btlan0 hpeisabtconf
btlan1 hpbasetconf
btlan3 hpbase100conf Internal (core) LAN card
btlan4 hpgsc100conf
btlan5 hppci100conf "external" PCI card A5230A
btlan6 hpsppci100conf V-class PCI lan card
gelan hpgelanconf GigaBit card A4926A
If you are getting replacement parts from a vendor, I would try and make
sure you can burn them in somewhere for at least a couple of days. You
might also look into keeping track of any serial numbers or unique ids on
the parts.
MOTHER BOARDS
log files on /var/adm/diag
Regardless of which vendor might replace a motherboard, HP will most likely
have to be present to flash proprietary firmware and set the CPU ID.
The cpu tests would probably get most of your mother board cache issues.
If you are getting replacement parts from a vendor, I would try and make
sure you can burn them in somewhere for at least a couple of days. You
might also look into keeping track of any serial numbers or unique ids on
the parts.
FIRMWARE (GSP, PDC)
You can cpu firmware at boot and upgrade as needed. 'stm' can often give
you firmware on other components.
Here is an example of a GSP firmware upgrade:
The procedure for upgrading GSP Firmware (from B.02.07 to B.02.20):
1) If Firmware is older than B.02.15 then it must be updated in step
sequence to revision B.02.15 first before it can be updated to B.02.20.
Install GSP Firmware B.02.15 patch PF_CCANGSPB0215 (best done by HP CE as
laptop needed to set up private network to talk to GSP card)
2) While HP-UX patches are not technically required they are highly
recommended to be installed at B.02.15 update (network patch requires a
reboot).
For 11.00:
1. PHNE_27393, Cumulative Mux and Pty Patch, superseded by PHNE_27788,
then by PHNE_29519
2. PHCO_27370, mksf cumulative patch
For 11.11:
1. PHNE_26326, Cumulative Mux and Pty Patch, superseded by PHNE_32616
2. PHCO_27243, mksf cumulative patch, 7/23/2002, superseded by PHCO_32202
3) Install A6696B GSP Firmware B.02.20 patch PF_CCANGSPB0220 (5/19/2003)
4) Server does not have to be shut down during the GSP Firmware update
itself, but at the end of the GSP Firmware update the server needs to be
rebooted in order for PDC Online Diagnostics to communicate again with GSP
(using new GSP Firmware version).
Here is an example of a PDC firmware upgrade:
Upgrading PDC Firmware (requires reboot):
For the RP5430 (L1500) and RP5470 (L3000):
Install Firmware 44.12 patch PF_CARIW4412, which is a user-installable
patch:
For 11.00:
PHSS_30631, Warning, superseded by PHSS_30839 (9/15/2004)
For 11.11:
PHSS_30632 (4/23/2004)
For the RP7405, RP7410 and RP8400:
Install Firmware 6.4 [17.009] (from current 5.0 [16.011]) patch
PF_CKEYMAT0604, (created 4/4/2005)
FIBER CHANNEL CARDS
commands: ioscan, fcmsutil, dmesg
The 'fcmsutil' command is a diagnostic tool to be used for the TACHYON
A3740A, A3591A, A3404A, A3636A and TACHYON TL A5158A, A6684A, A6685A,
TACHYON XL2 A6795A, DUAL PORT A6826A and FC/GigE Combo A9782A/A9784A
Fiber Channel Host Bus Adapters. This command provides the ability to
perform Fibre Channel Test and Echo functionality, read the card's
registers, etc. This command requires the use of a device file to indicate
the interface over which the requested command needs to be performed.
Examples (from the man page):
Print a short listing of the statistics maintained by the driver, with
/dev/td1 as the device file.
fcmsutil /dev/td1 stat -s
Send 5 echo packets of 200 bytes each to a remote N_Port with loop_id 4,
with /dev/td1 as the device file
fcmsutil /dev/td1 echo -l 4 200 5
Print a short listing of the statistics of the device whose
remote-N-Port-ID is 0x02ae4 and with /dev/td1 as the device file
fcmsutil /dev/td1 devstat 0x02ae4
Clear the device statistics of the device whose wwn is 0x100000e002219f45
and with /dev/td1 as the device file
fcmsutil /dev/td1 clear_devstat -w 0x100000e002219f45
Perform a Internal loopback test, sending 1000 packets with /dev/fcd2 as the
device file
fcmsutil /dev/fcd2 lb int crpat 1000
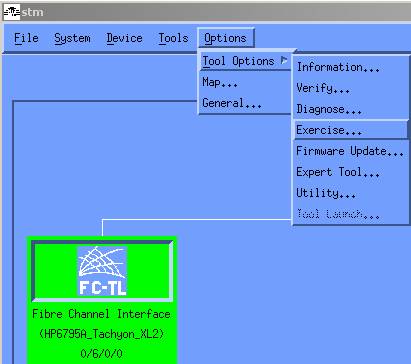
You can use 'stm' to test a fiber card.
Example:
If you are getting replacement parts from a vendor, I would try and make
sure you can burn them in somewhere for at least a couple of days. You
might also look into keeping track of any serial numbers or unique ids on
the parts.
Q4 Procedure for Analyzing System Crashes
Fault codes
K class
The initial FAULT CBF0 means "High PRiority Machine Check occurred".
FLT 5007 means "Directed Error" on the Processor Memory Bus, with a =
Master ID of 0 (implies CPU 0) and processor memory bus 0.
FLT 5408 means "Broad Error", master ID of 4 means on IOA 0 (system =
board).
FLT 5508 means "Broad Error", master ID of 5 means on IOA 1 (system =
board).
FLT CBFC means "PDCE HPMC processiung complete, failed to branch to OS =
HPMC, halt CPU", ACTION: FOllow the action for other HPMC codes beginning
with numerics
FLT CBF1 means "OS did not replace IVA". ACTION: FOllow the action for =
other HPMC codes beginning with numerics
--
             ---> Please post QUESTIONS and SUMMARIES only!! <---
        To subscribe/unsubscribe to this list, contact majordomo@dutchworks.nl
       Name: hpux-admin@dutchworks.nl     Owner: owner-hpux-admin@dutchworks.nl

 Archives:  ftp.dutchworks.nl:/pub/digests/hpux-admin       (FTP, browse only)
            http://www.dutchworks.nl/htbin/hpsysadmin   (Web, browse & search)
This archive was generated by hypermail 2.1.7 : Sat Apr 12 2008 - 11:02:50 EDT